NATS
Also refer to the troubleshooting section of the SEAL NATS documentation.
Activate NATS Monitoring
To check the NATS status, you can enable the monitoring port in nats.conf.
-
Open the NATS configuration file in an editor.
-
Windows:
C:\ProgramData\SEAL Systems\config\nats.conf -
Linux:
/opt/seal/etc/nats.conf
-
-
Activate the NATS monitoring port:
# HTTP monitoring port monitor_port: 8222 -
Restart NATS.
plossys service stop seal-nats plossys service start seal-nats -
If extern access to NATS monitoring is needed, open firewall port
8222. -
Open NATS monitoring in a browser.
http://localhost:8222 -
Cluster connections can be seen under
General.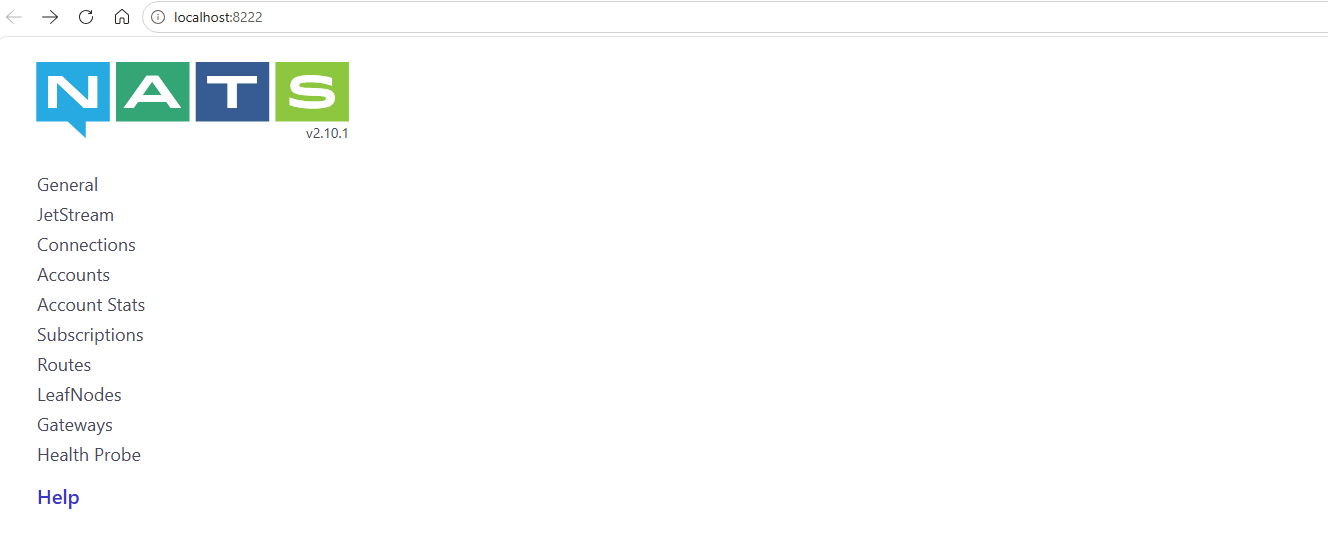
Check the NATS Connection
Use the NATS CLI to check the connection to a NATS server.
- Open a command prompt.
-
Switch to the NATS installation directory. The NATS CLI is not in the search path of the operating system.
- Windows:
cd "C:\Program Files\SEAL Systems\seal-nats" - Linux:
cd /opt/seal/seal-nats
- Windows:
-
Check the connection:
- Windows:
.\nats.exe server check connection [-s nats://<hostname>:4222] - Linux:
./nats server check connection [-s nats://<hostname>:4222]
- Windows:
Activate NATS Debug and Trace Logging
In most cases, the standard NATS log already contains enough information to diagnose a problem.
Caution - log file size
Only activate trace logging in an emergency. The log file grows very quickly to an enormous size.
-
Open the NATS configuration file in an editor.
- Windows:
C:\ProgramData\SEAL Systems\config\nats.conf - Linux:
/opt/seal/etc/nats.conf
- Windows:
-
Add or activate the following lines:
debug: true trace: true -
Restart NATS.
plossys service stop seal-nats
plossys service start seal-nats